
 Back to Cnchemicals.com
- China’s domestic consumption will fall, but rising overseas demand will drive growth
- South East Asia, South America and Africa will continue to be major export markets
- Full report can be downloaded at: www.cnchemicals.com/Product/Report/2628-production-and-market-of-paraquat-in-china-edition-7.html
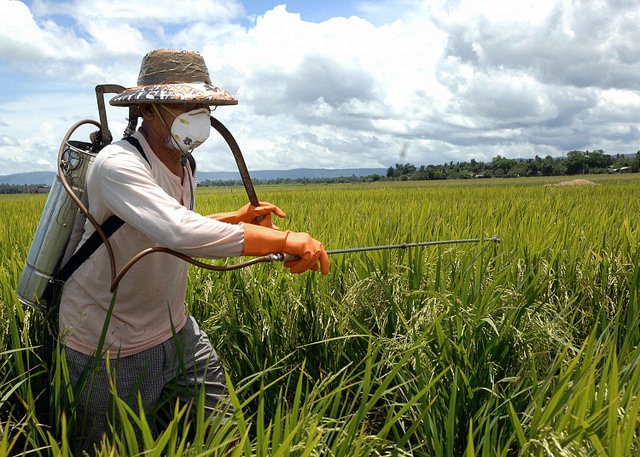
China’s production of paraquat, one of the world’s most popular non-selective
herbicides, will grow at a CAGR of 5.8% over the next four years, according to
a new report by market intelligence firm CCM.
Rising exports
Increasing overseas demand will be the main driver of this growth,
particularly due to the spread of no-till farming techniques.
Chinese paraquat exports have been increasing steadily in recent
years; exports of 42% paraquat TK, for example, rose 35% between 2010 and 2014.
The only decrease during this period was in 2014, when many Chinese pesticide
companies concentrated on building up large inventories ahead of the ban on
producing paraquat AS for domestic use, which came into effect in July 2014.
South America, South East Asia and (in the case of paraquat AS
formulations) Africa have been the major markets Chinese paraquat during this
period, and CCM predicts that this trend will continue in the future.
In 2014, the biggest export destinations for Chinese paraquat TK were
Indonesia, Thailand, Brazil, Malaysia and Australia, with these countries
accounting for 19%, 13%, 8%, 6% and 6% of exports respectively.
For paraquat AS formulations, meanwhile, the largest export markets
were Nigeria (27%), Vietnam (10%), Thailand (9%), Ghana (8%) and Australia
(4%).
Ban on domestic use of paraquat AS to
halve domestic consumption
China’s paraquat industry has become increasingly dependent on exports
– over 83% of the paraquat produced in China was exported in 2014, and this
figure rose to 94% in Q1 2015.
And the industry will become even more oriented towards exports from
July 2016, when a ban on the sale and use of paraquat AS in China will come
into effect.
Actual domestic consumption of paraquat rose 11% during 2010-2014 to
over 20,500 tonnes, but CCM forecasts that this figure will plummet by over 50%
in 2016 following the introduction of the ban. However, consumption is likely
to rebound from 2018 onwards as the prices of new formulations to replace
paraquat AS decrease.
Increasing concentration of paraquat industry
China’s top five paraquat producers – Nantong Syngenta, Nanjing
Redsun, Hubei Sanonda, Shandong Luba and Shandong Kexin – have become
increasingly dominant since 2010. In that year, the five companies accounted
for 76% of China’s paraquat exports, but by 2014 this had increased to 83%.
CCM predicts that further industry concentration will take place in
the paraquat TK industry over the next four years thanks to Chinese government policy
targeting increased investment in R&D and environmental protection measures
among paraquat manufacturers, and restrictions on new market entrants.
More details on China’s paraquat market can be found in CCM’s new
report, Production and Market of Paraquat in China. The report provides detailed historical
data and analysis of how China’s paraquat industry has developed over the last
fifteen years, and forecasts for the period 2015-2019.
The report includes in-depth analysis of:
- Raw materials markets, including pyridine and methyl chloride
- Production technologies used in China, including costs and R&D status
- Paraquat registrations
- Supply situation, including production capacity and output, industry concentration
- Prices
- Import/export of paraquat
- Consumption, including analysis by application, region and crop
- Development trends, including demand, policy and research on non-liquid formulations
- Profiles of leading Chinese paraquat and pyridine manufacturers
For more information about CCM and our coverage of China’s pesticides
market, please visit www.cnchemicals.com, or get in touch directly by emailing econtact@cnchemicals.com or calling + 86-20-37616606.
-
Average:
-
Reads(5253)
-
Permalink